Cartografía histórica
Los mapas son representaciones más políticas que objetivas sobre un lugar. Al seleccionar y codificar algunas piezas de información, mientras se silencian otras, los mapas funcionan como discursos políticos y son usados como “órdenes de marcha” para construir geografías.
Los mapas de vista panorámica incluidos en esta sección son capítulos de la narrativa de la ciudad de Bogotá como un artefacto moderno. A finales del siglo XIX y durante las primeras décadas del siglo XX, los planos urbanos efectivamente ayudaron a consolidar la idea de Bogotá como un logro humano en donde las montañas, los ríos, la topografía y toda la ecología de la ciudad ya no eran visibles, y por lo tanto ya no importaban.
Desde su fundación en el siglo XVI y hasta finales del siglo XIX, la ciudad creció lentamente sin expandirse más allá de las barreras naturales de los Cerros Orientales y los ríos San Francisco y San Cristóbal. La mayoría de mapas de la época reconocían gráficamente que la ciudad dependía de los Cerros Orientales, enfatizando el pie de monte a través del uso de colores, sombras y texturas. Los ríos, usualmente dibujados como anchas líneas sinuosas, descendían de las montañas deforestadas y cruzaban la trama urbana hasta alcanzar la sabana occidental, representada en algunos planos como una extensa planicie con humedales casi tan grandes como la misma ciudad.
El mapa dibujado en 1894 por el geógrafo y anarquista francés Elisée Reclus, adopta una perspectiva regional de la ciudad y otorga un rol prominente a la estructura ecológica de Bogotá. El mapa muestra los ríos que descienden desde los páramos hasta encontrar el Río Funza, también conocido como Río Bogotá. A diferencia de sus colegas cartógrafos, Reclus orientó su mapa con el norte en la parte superior.
Sin embargo, para esta misma época un discurso cartográfico diferente estaba ganando un lugar entre los topógrafos colombianos. El mapa redibujado por Rafael Álvarez Salas en 1894 basándose en el mapa elaborado por Carlos Clavijo en 1891, es uno de los planos reproducidos con mayor frecuencia y también constituye un distintivo “mapa de transición” en la historia de Bogotá: la ciudad moderna está emergiendo, pero la naturaleza sigue presente. La historia del agua es visible en las calles serpenteantes—elocuentes huellas de los cauces de los ríos—, así como en los tanques de almacenamiento de agua y en los baños públicos. La aún pequeña y concéntrica ciudad se disuelve en el pie de monte de las montañas orientales.
Para 1910, año de importantes celebraciones públicas por el primer centenario de la independencia de España, la transición geográfica se había completado y el ingeniero Alberto Borda Tanco conmemoraba a la ciudad moderna en su mapa. La ciudad ahora se representa separada claramente de los Cerros Orientales, la sabana se silencia y Bogotá aparece como un conjunto ordenado—es decir, bajo control—de manzanas.
El mapa elaborado en 1935 por el poderoso ingeniero Julio César Vergara y Vergara es la visión histórica de una generación de urbanistas. Después de compilar una serie de mapas históricos, algunos bastante conocidos y otros poco comunes, el mapa de Vergara y Vergara representó la historia de una dramática expansión urbana que, con el tiempo, superaría lo que él había imaginado. Al estar canalizados, los ríos fueron dibujados como líneas delgadas. Por su parte, manzanas, calles, parques y otras instalaciones urbanas adquirieron prominencia visual.
Para visualizar estos mapas históricos de la ciudad de Bogotá y sus alrededores, los cuales han sido superpuestos sobre imágenes satelitales georeferenciadas de la región, necesita tener Google Earth instalado y abierto en su computador.
El siguiente video tutorial le ayudará a navegar en los mapas interactivos:
The original virtual exhibition features a video tutorial that will help users navigate the interactive maps. View the tutorial here (https://www.youtube.com/watch?v=7oWwOaE0i2o).
Trabajando con Cartografía Histórica en Google Earth
Video tutorial que explica cómo trabajar con los mapas en la sección de “Cartografía Histórica” de la exposición virtual “Las corrientes de la ciudad: Una historia del agua en la Bogotá del siglo XX”. Esta exposición ha sido elaborada por Stefania Gallini, Laura Felacio, Angélica Agredo y Stephanie Garcés, y publicada por el Rachel Carson Center en environmentandsociety.org.
(0:00-0:14) Esta selección de cartografía histórica de Bogotá ha sido georeferenciada a través de imágenes satelitales proporcionadas por Google Earth, permitiendo superponer los mapas históricos sobre el área urbana actual, ajustando el zoom y la transparencia según su interés.
(0:15-0:19) Para ver los mapas históricos en Google Earth, debe tener instalado Google Earth en su computador.
(0:20-0:24) Una vez haya verificado que cumple con este requerimiento, descargue los archivos KMZ que corresponden a cada mapa.
(0:25-0:30) Puede guardar los archivos en la carpeta de su preferencia o simplemente dejarlos en la carpeta predeterminada de descargas.
(0:31-0:34) Luego abra Google Earth y vaya a la pestaña de archivo en la esquina superior izquierda.
(0:35-0:39) Abra la pestaña, haga click en abrir de nuevo y busque los archivos KMZ que acaba de descargar y guardar.
(0:40-0:45) Una vez haya seleccionado un archivo KMZ, haga click en abrir en la esquina inferior derecha de la ventana emergente.
(0:46-0:52) El mapa histórico será superpuesto en la fotografía satelital y usted podrá ajustar tanto el zoom como la transparencia.
(0:53-0:58) El control del zoom está en la parte derecha de la pantalla y le permite aumentar o disminuir el zoom en el mapa histórico superpuesto.
(0:59-1:02) El control de transparencia se encuentra en la mitad de la columna en la parte izquierda de la pantalla.
(1:03-1:10) Este control es visible siempre y cuando haya activado el botón que tiene un pequeño cuadrado al interior, localizado justo a la derecha del botón con la lupa.
(1:11-1:16) Puede deslizar el control hacia la derecha o la izquierda para aumentar y disminuir el grado de transparencia del mapa histórico.
(1:17-1:28) También puede ajustar la posición, rotación e inclinación de la visualización utilizando las flechas de la palanca de control ubicada en la esquina superior derecha de la pantalla, o simplemente haciendo click y desplazando el cursor sobre la visualización.
1. Mapa de Elisée Reclus (1894)
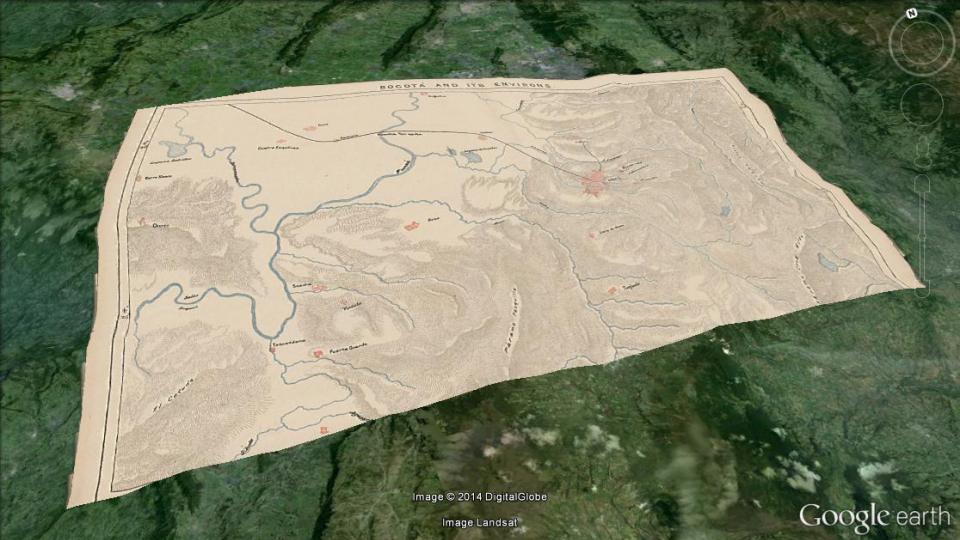
Map made by the French geographer Elisée Reclus in 1894. It shows the surroundings of Bogotá, making evident the nearby towns as well as the topography and hydrology of the area. North of Bogotá, one can see the suburb of Chapinero, and farther away the town of Usaquén, while the small village of Tunjuelo appears in the south. The wide western savanna is the home of many towns, such as Engativá, Fontibón, Funza, Bosa, and Soacha, most of which are part of the urban area of Bogotá today. The Fucha and Arzobispo rivers emerge from the Cruz Verde Páramo, while the San Francisco and San Agustín rivers spring from the Eastern Mountains, closer to the city. All of these rivers flow down the slopes, going through the city and its peripheries to finally arrive in the Funza River, also known as Bogotá River, which is drawn in the northwest corner of the map.
Map made by the French geographer Elisée Reclus in 1894. It shows the surroundings of Bogotá, making evident the nearby towns as well as the topography and hydrology of the area. North of Bogotá, one can see the suburb of Chapinero, and farther away the town of Usaquén, while the small village of Tunjuelo appears in the south. The wide western savanna is the home of many towns, such as Engativá, Fontibón, Funza, Bosa, and Soacha, most of which are part of the urban area of Bogotá today. The Fucha and Arzobispo rivers emerge from the Cruz Verde Páramo, while the San Francisco and San Agustín rivers spring from the Eastern Mountains, closer to the city. All of these rivers flow down the slopes, going through the city and its peripheries to finally arrive in the Funza River, also known as Bogotá River, which is drawn in the northwest corner of the map.
Historical map: Public domain. Courtesy of Biblioteca Nacional de Colombia.
Overlap of the historical map over satellite imagery from Google Earth: Creative Commons Attribution-NonCommercial-ShareAlike 3.0 Unported License. 2014. Biblioteca Nacional de Colombia.
Por favor haga click en el siguiente enlace para descargar y abrir el archivo de Google Earth:
1894_bogota_map_elisee_reclus.kmz
2. Mapa de Rafael Álvarez Salas (1894)
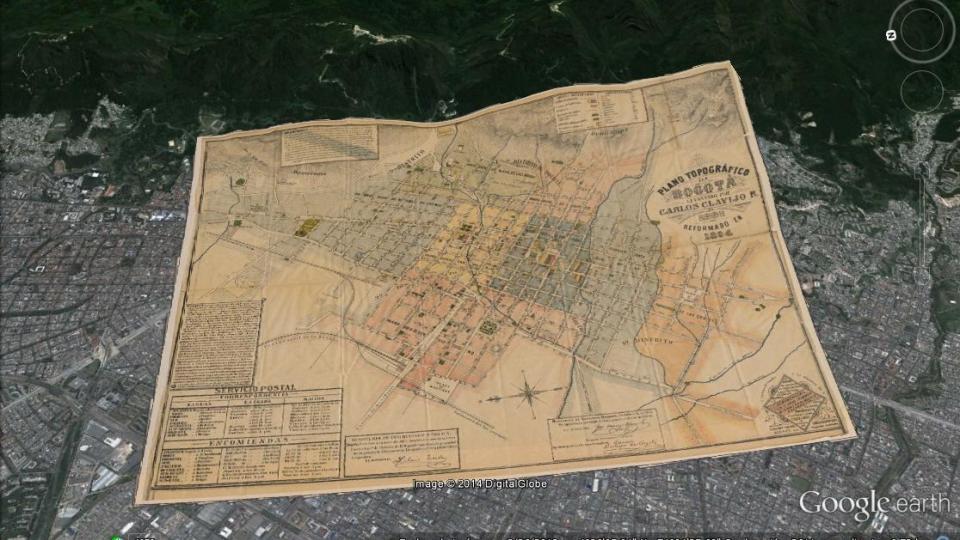
Map made by Carlos Clavijo in 1891 and revised by Rafael Álvarez Salas in 1894. By this time, the city of Bogotá was divided into five police quarters and eight ecclesiastical districts called parroquias, which are shaded in different colors on the map. The map identifies the main squares and parks of the city, the government buildings, the educational and cultural institutions, and the Catholic churches, as well as a number of banks, factories, brickworks, hotels, and restaurants. The rivers and streams that descend from the mountains of Monserrate and Guadalupe run through the city, shaping the streets and blocks. Near the San Bruno Rivulet, tributary of the San Francisco River, are the water storage tanks of the Egipto neighborhood, used since the late nineteenth century to store water for the municipal aqueduct service. Northeast of the city, in the foothills of Monserrate, are the Baños de la Tuerta Chepa, an example of what once were public bathhouses.
Map made by Carlos Clavijo in 1891 and revised by Rafael Álvarez Salas in 1894. By this time, the city of Bogotá was divided into five police quarters and eight ecclesiastical districts called parroquias, which are shaded in different colors on the map. The map identifies the main squares and parks of the city, the government buildings, the educational and cultural institutions, and the Catholic churches, as well as a number of banks, factories, brickworks, hotels, and restaurants. The rivers and streams that descend from the mountains of Monserrate and Guadalupe run through the city, shaping the streets and blocks. Near the San Bruno Rivulet, tributary of the San Francisco River, are the water storage tanks of the Egipto neighborhood, used since the late nineteenth century to store water for the municipal aqueduct service. Northeast of the city, in the foothills of Monserrate, are the Baños de la Tuerta Chepa, an example of what once were public bathhouses.
Historical map: Public domain. Courtesy of Biblioteca Nacional de Colombia.
Overlap of the historical map over satellite imagery from Google Earth: Creative Commons Attribution-NonCommercial-ShareAlike 3.0 Unported License. 2014. Biblioteca Nacional de Colombia.
 This work is licensed under a Creative Commons Public Domain Mark 1.0 License.
Por favor haga click en el siguiente enlace para descargar y abrir el archivo de Google Earth:
1894_bogota_map_rafael__alvarez_sala.kmz
3. Mapa de Alberto Borda Tanco (1910)
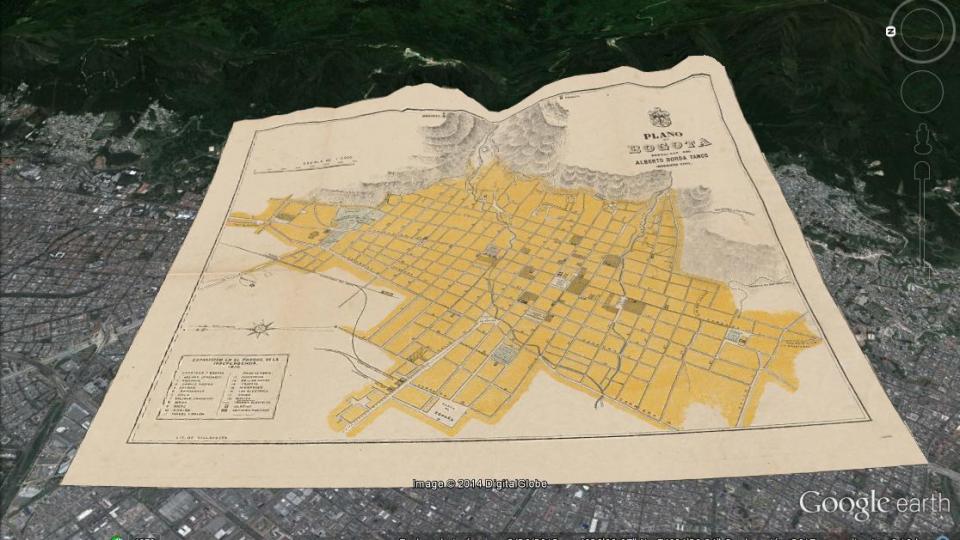
Map made in 1910 by the civil engineer Alberto Borda Tanco, elected President of the Board of Celebrations for the First Centenary of the Colombian Independence. The map was a cartographic support for the works and events that were part of the celebrations, thus showing the newly opened Parque de la Independencia with the different pavilions that were built for the national exhibition. But it also presents the image that engineers had about a city that had just begun its search for modernity. That is why the map shows not only the churches and government buildings, but also the organized blocks of the urbanized area, interspersed with squares and green parks and defined by paved streets over which there were electric or horse-drawn tram lines. Three railways and a cemetery located on the western outskirts also account for a glimpse of urban modernity. The urban water system is also marked: the map shows the San Agustín and San Francisco rivers, as well as the storage tanks located in the Egipto and San Diego neighborhoods, over the foothills of the Eastern Mountains. Paradoxically, the San Francisco River flowed down from the mountains through the Paseo Bolívar, a well-known poor settlement that lacked proper aesthetic and sanitary conditions, refusing any hint of modernity.
Map made in 1910 by the civil engineer Alberto Borda Tanco, elected President of the Board of Celebrations for the First Centenary of the Colombian Independence. The map was a cartographic support for the works and events that were part of the celebrations, thus showing the newly opened Parque de la Independencia with the different pavilions that were built for the national exhibition. But it also presents the image that engineers had about a city that had just begun its search for modernity. That is why the map shows not only the churches and government buildings, but also the organized blocks of the urbanized area, interspersed with squares and green parks and defined by paved streets over which there were electric or horse-drawn tram lines. Three railways and a cemetery located on the western outskirts also account for a glimpse of urban modernity. The urban water system is also marked: the map shows the San Agustín and San Francisco rivers, as well as the storage tanks located in the Egipto and San Diego neighborhoods, over the foothills of the Eastern Mountains. Paradoxically, the San Francisco River flowed down from the mountains through the Paseo Bolívar, a well-known poor settlement that lacked proper aesthetic and sanitary conditions, refusing any hint of modernity.
Historical map: All rights reserved. Courtesy of Biblioteca Nacional de Colombia.
Overlap of the historical map over satellite imagery from Google Earth: Creative Commons Attribution-NonCommercial-ShareAlike 3.0 Unported License. 2014. Biblioteca Nacional de Colombia.
The copyright holder reserves, or holds for their own use, all the rights provided by copyright law, such as distribution, performance, and creation of derivative works.
Por favor haga click en el siguiente enlace para descargar y abrir el archivo de Google Earth:
1910_bogota_map_alberto_borda_tanco.kmz
4. Mapa de Julio César Vergara y Vergara (1935)
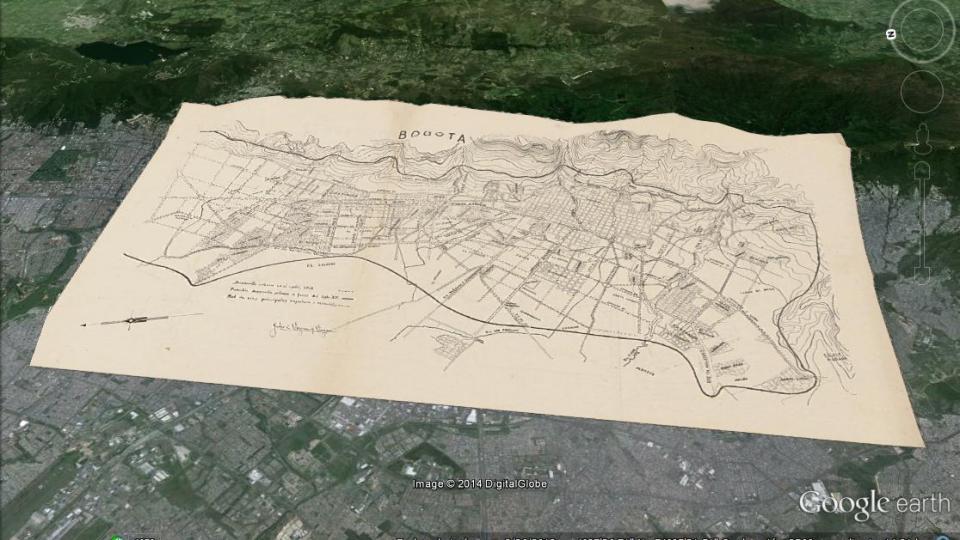
Made by Julio César Vergara y Vergara in 1935, this map was included in an academic article about the urban development of Bogotá four centuries after the Spaniard foundation in 1538. The map shows the existing neighborhoods by the 1930s, along with a proposal for widening of major roads. The author also includes an hypothetical urban perimeter by the end of the twentieth century, for a city with an population estimated at 900,000. However, Bogotá had more than six million inhabitants by the end of the century, thus surpassing this hypothetical perimeter. The map shows the course of the Arzobispo, Fucha, and San Francisco rivers. The last of these, near its origins close to the mountains, has already been channeled under an avenue named Avenida Jiménez.
Made by Julio César Vergara y Vergara in 1935, this map was included in an academic article about the urban development of Bogotá four centuries after the Spaniard foundation in 1538. The map shows the existing neighborhoods by the 1930s, along with a proposal for widening of major roads. The author also includes an hypothetical urban perimeter by the end of the twentieth century, for a city with an population estimated at 900,000. However, Bogotá had more than six million inhabitants by the end of the century, thus surpassing this hypothetical perimeter. The map shows the course of the Arzobispo, Fucha, and San Francisco rivers. The last of these, near its origins close to the mountains, has already been channeled under an avenue named Avenida Jiménez.
Historical map: All rights reserved. Courtesy of Biblioteca Nacional de Colombia.
Overlap of the historical map over satellite imagery from Google Earth: Creative Commons Attribution-NonCommercial-ShareAlike 3.0 Unported License. 2014. Biblioteca Nacional de Colombia.
The copyright holder reserves, or holds for their own use, all the rights provided by copyright law, such as distribution, performance, and creation of derivative works.
Por favor haga click en el siguiente enlace para descargar y abrir el archivo de Google Earth:
1935_bogota_map_vergara_y_vergara.kmz


