Mapping
Consider these two maps of the lands occupied by the federal Nevada Test Site:
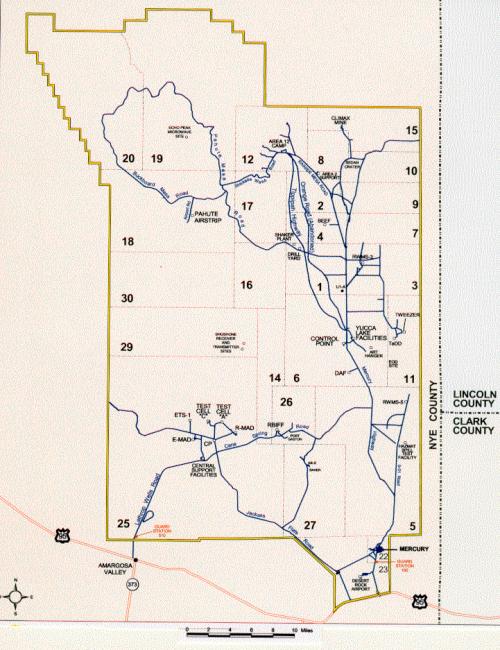
US government map of the Nevada Test Site.
US government map of the Nevada Test Site.
Nevada Test Site Guide, DOE/NV-715. This map is in the public domain as a work of the federal government of the United States.
View source.
 This work is licensed under a Creative Commons Public Domain Mark 1.0 License.

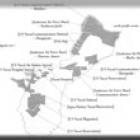
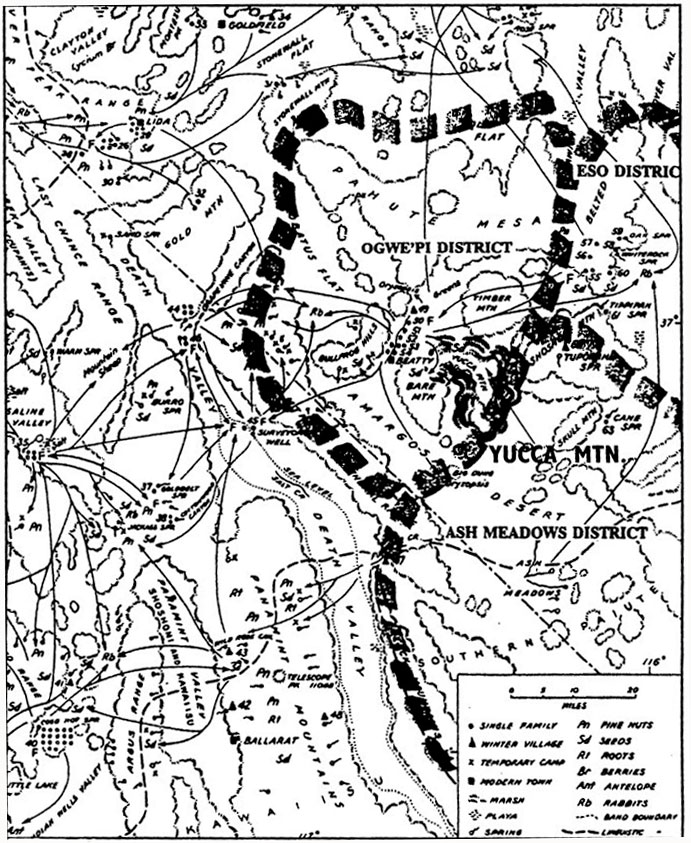
Native American use patterns in the Nevada Test Site and Yucca Mountain area.
Native American use patterns in the Nevada Test Site and Yucca Mountain area.
Kuletz, Valerie, The Tainted Desert: Environmental Ruin in the American West. New York: Routledge, 1998, 126.
Republished with permission of Taylor and Francis Group LLC Books; permission conveyed through Copyright Clearance Center, Inc.
This work is used by permission of the copyright holder.
The federal government map labels only county lines, military facilities, transportation infrastructure, and the abstract grid of numbered “areas” that organizes the terrain. Land features and Native American names are present, but only when they designate roads and sites: “Pahute Mesa Road,” “Shoshone Receiver and Transmitter Sites,” “Lathrop Wells Road,” “Yucca Lake Facilities.” This map presents the Nevada Test Site as an isolated laboratory, erasing the landscape, its prior occupants, and any downwinders who live close enough to be affected by the military tests conducted here. The two “guard stations” labeled in red and a solid yellow line suggest that the site and its activities are hermetically sealed off from the rest of the region. The bareness of this map depicts the area as an uninhabited desert ripe for military use as a nuclear “sacrifice zone”: as Terry Tempest Williams writes, “A blank spot on the map translates into empty space, space devoid of people, a wasteland perfect for nerve gas, weteye bombs, and toxic waste” (Refuge, 241).
The second map, by contrast, exhibits the Nevada Test Site in the broader context of Native American settlements and land use. In addition to indicating detailed terrain features such as playas, springs, and marshes, the map identifies Native American settlements (camps, towns, single family residences, and winter villages) and important resources such as pine nuts, roots, and rabbits. Instead of mapping county lines and test area boundaries, this map exhibits indigenous districts, band boundaries, and linguistic boundaries. Instead of featuring modern roads, it uses arrows to indicate patterns of movement and land use. The land around Yucca Mountain and the Test Site appears here not as a desert wasteland but as an abundant landscape inhabited by dynamic groups. The boundary between Nevada and California cuts across the center of this map. But the meadows, mountains, and pathways depicted here flow right across that boundary, reminding us how federal and state boundaries can obscure or obstruct preexisting modes of living. Whereas “Euroamerican space [is] organized according to a series of highly rationalized, straight, gridlike boundaries imposed from above,” writes one of this map’s creators, “The ancient Indian pathways that converge at Yucca Mountain and that organize the space of this region by way of Indian occupation and movement lie beneath the surface of other constructions of space” (Kuletz, Tainted 127, 126). Among other things, Native American space here is organized according to spiritual mountains, rock paintings, and other sacred sites (127).
Because they are commonly perceived as objective representations of space and data, maps exert considerable power in framing perceptions of places, their history, and their inhabitants. Through the selection of parameters, scale, place names, framing, and decorative features, maps convey specific political interests: as Dennis Wood and John Fels write in The Power of Maps, “interests are embodied in the map as presences and absences” (1992, 1). Mapping has been instrumental in legitimizing US imperialism, waging war, and identifying strategic locations for foreign bases. However, maps also play an important role in visually rendering both the scope and the distribution patterns of environmental impacts: as Kuletz explains in a book filled with detailed maps that she helped produce, mapping can perform “the political practice of seeing purposefully unmarked and secret landscapes; it makes visible those who have been obscured and silenced within those landscapes” (1998, 7). By exposing the sites, scale, and environmental effects of US military testing and training, maps can draw connections between local struggles for demilitarization and provide the groundwork for coalitions between diverse colonized and racialized groups.
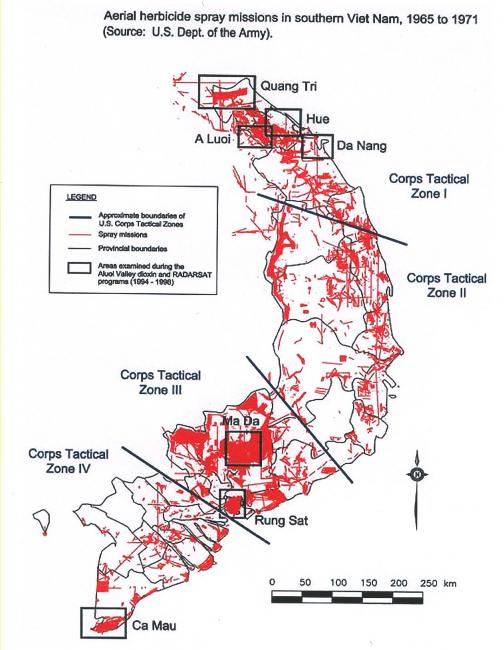
Locations of aerial herbicide spray missions by the US army in Southern Vietnam between 1965 and 1971.
Locations of aerial herbicide spray missions by the US army in Southern Vietnam between 1965 and 1971.
US Department of the Army. View source.
This work is licensed under a Creative Commons Public Domain Mark 1.0 License.
Although they underpin the Department of Defense’s map of global military command areas, US bases seldom appear on maps, and many people do not know where key strategic sites such as Diego Garcia, Guam, Vieques, and the Marshall Islands are located—just as, until 2001, the history and location of Guantánamo Bay had largely been forgotten. Because conventional maps privilege national boundaries and larger land masses, islands tend to pass unnoticed; as the Chamorro poet Craig Santos Perez puts it: “On some maps, Guam doesn’t exist; I point to an empty space in the Pacific and say, ‘I’m from here.’ On some maps, Guam is a small, unnamed Island; I say, ‘I’m from this unnamed place’” (2008, 7). Their relative invisibility on conventional maps reinforces claims that these places and their inhabitants are too small to matter in the grand scheme of global geopolitics: for example, “when asked about the nuclear testing program in the Marshall Islands, former US Secretary of State Henry Kissinger is reputed to have stated: ‘There’s only 90,000 people out there. Who gives a damn?’” (Kuletz 2002, 126).
If maps have been used to obscure the landscapes of militarization, they also have the capacity to convey critical information about the history and environmental consequences of militarization. Although it was produced long after the Vietnam War, the US army’s map of aerial herbicide spray missions in Southern Vietnam makes visible the scale of ecocide committed in the name of saving the inhabitants of the region.
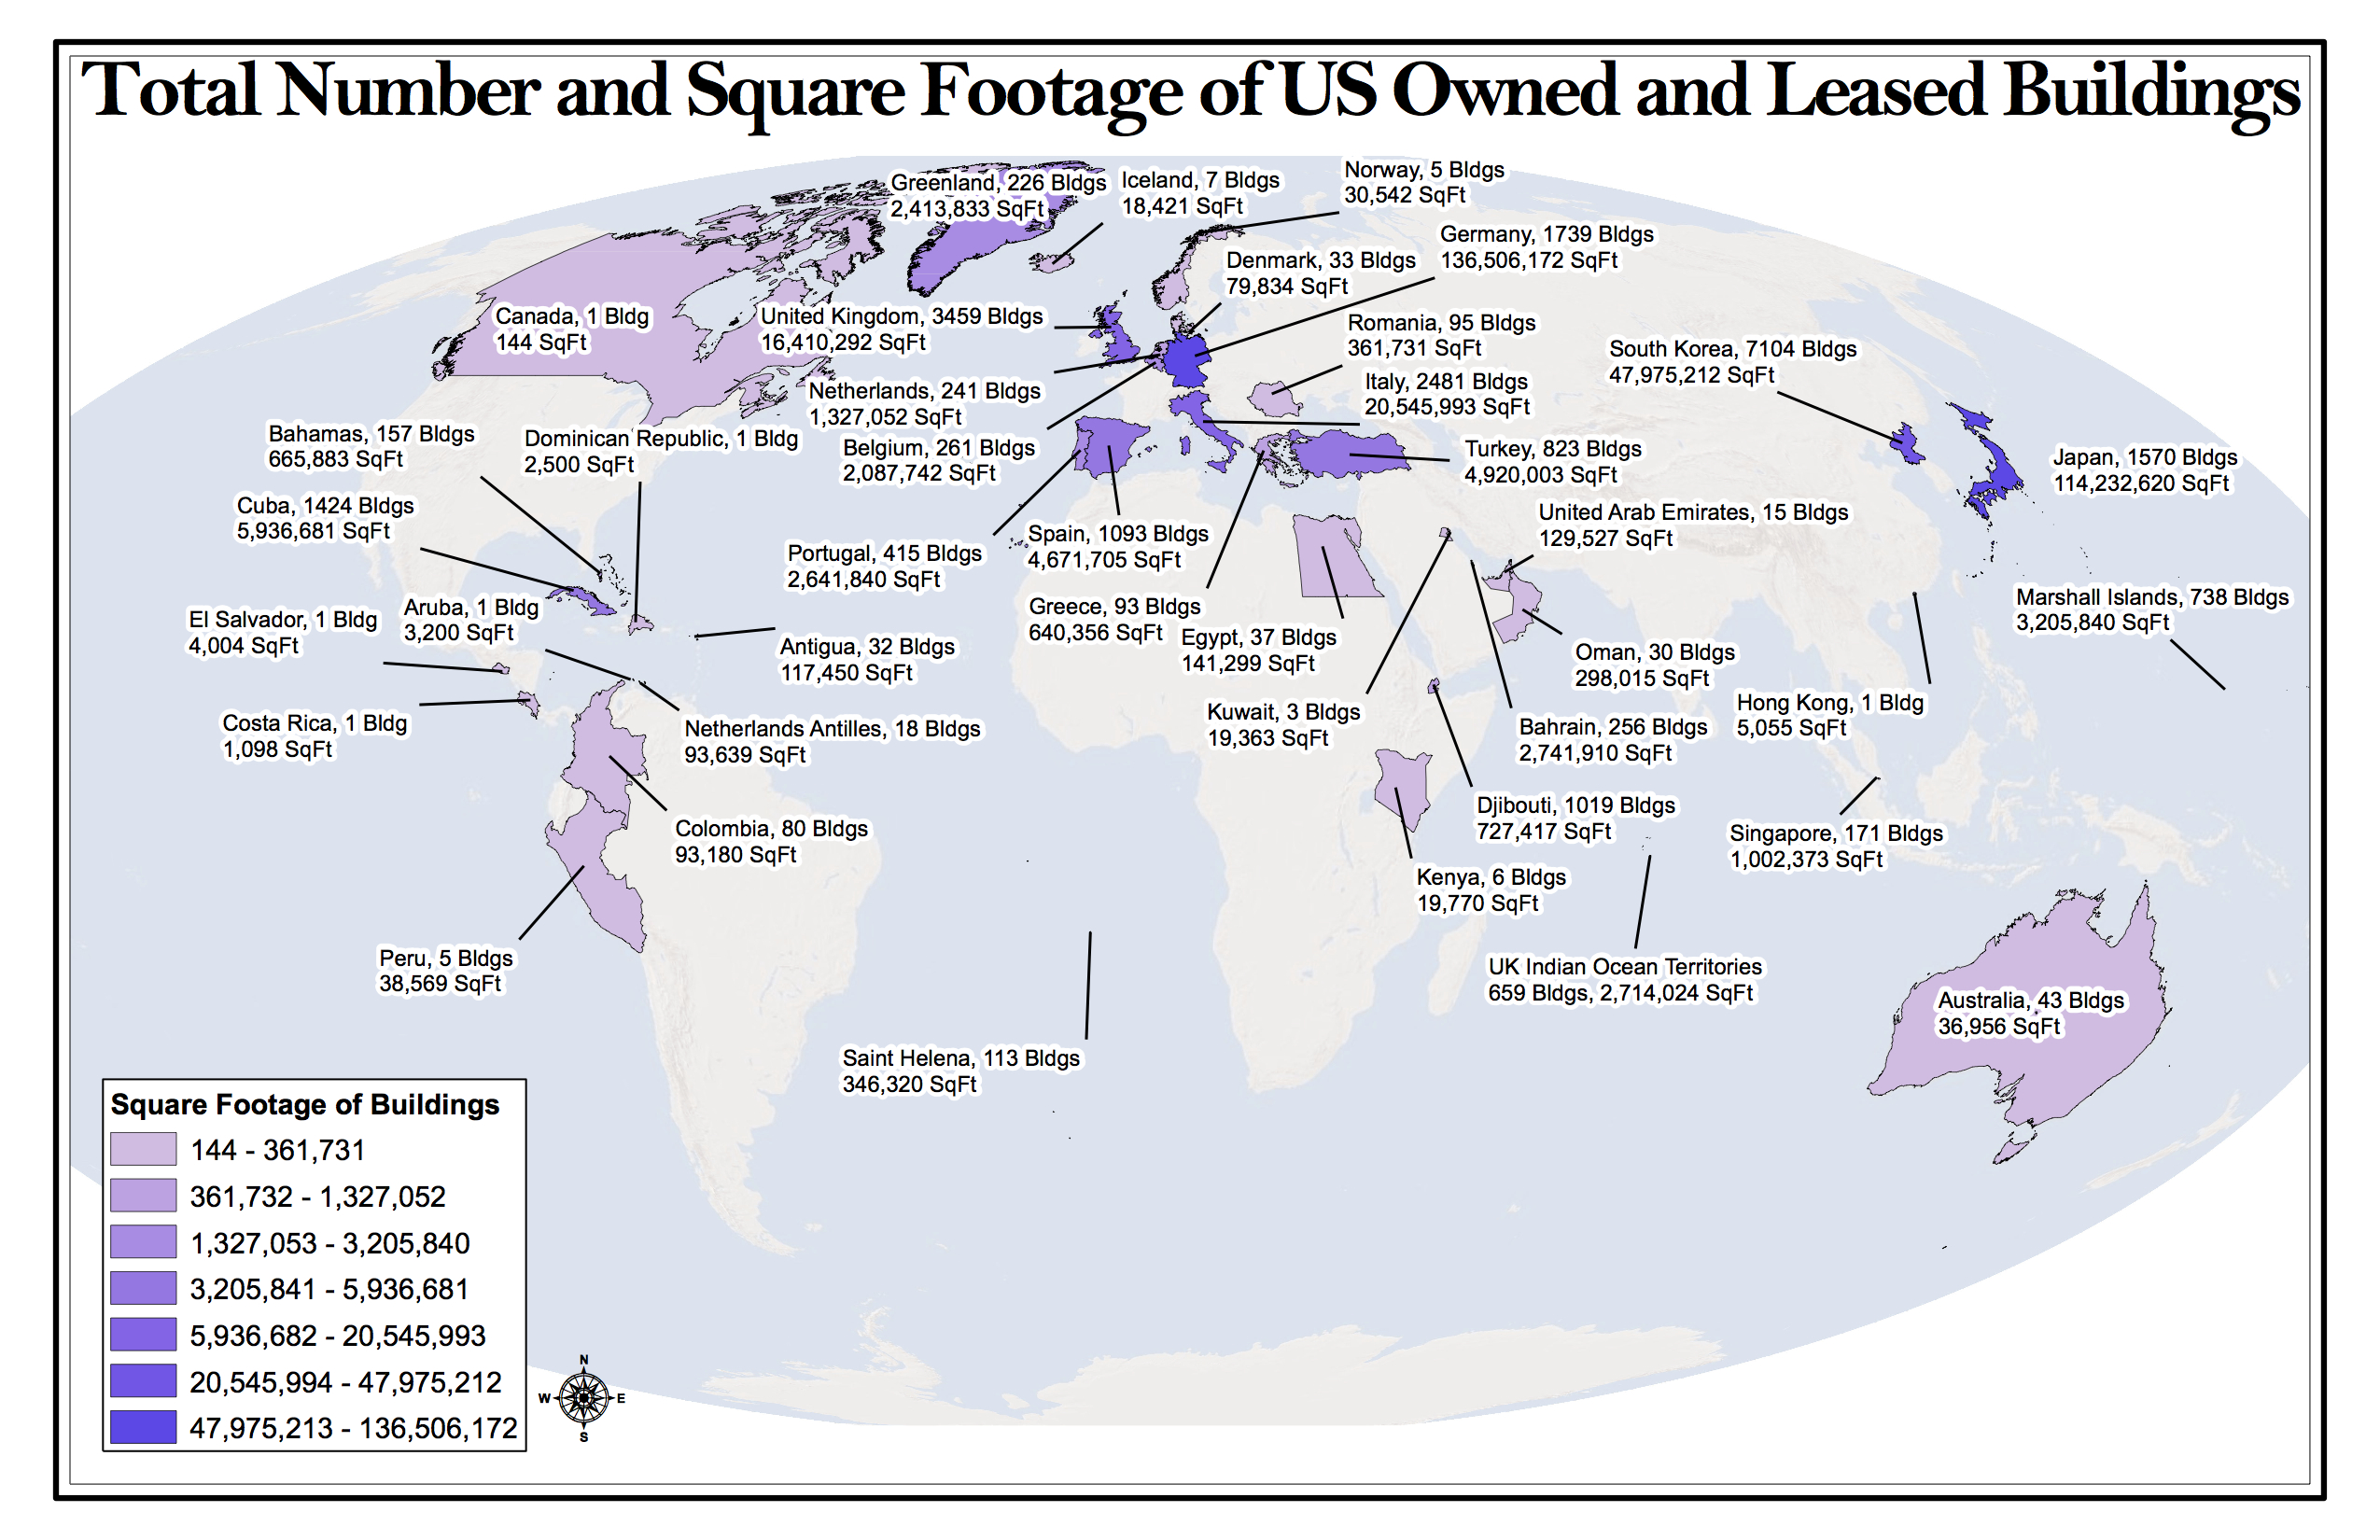
Earlier pages in this exhibit have included maps that similarly illustrate the scope of radioactive fallout in the Marshall Islands and the extent of military facilities on Guam. On a larger scale, the following map shows the size of all the foreign bases acknowledged by the Department of Defense:
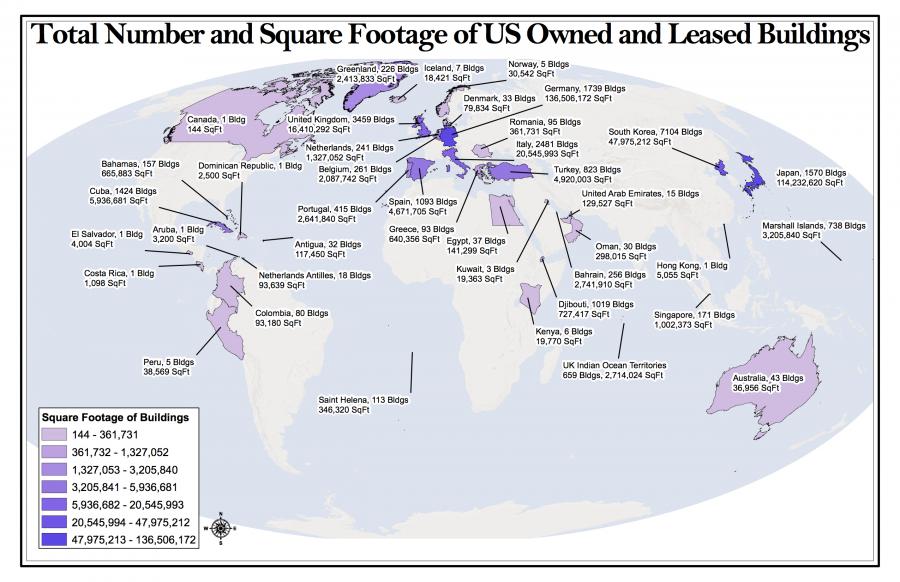
Kareem Shihab, Map showing the total number and square footage of US-owned and leased buildings, 2013.
In 2010, the Japanese artist Isao Hashimoto created a time-lapse map showing each of the 2,053 nuclear explosions between 1945-1998 worldwide (A Time-Lapse Map of Every Nuclear Explosion Since 1945). After a slow (but historically devastating) beginning during World War II, the explosions increased in frequency during the Cold War years until a peak of nearly 140 nuclear tests in 1962:
The original virstual exhibition features an embedded external video of a time-lapse map of every nuclear explosion since 1945 - by Isao Hashimoto. You can link to the video here: https://youtu.be/LLCF7vPanrY.
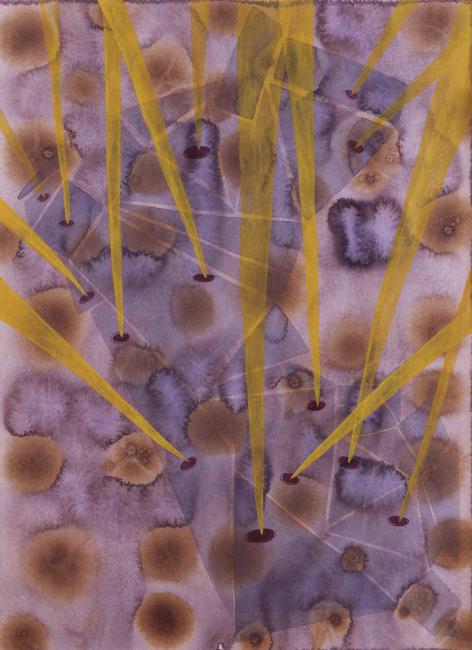
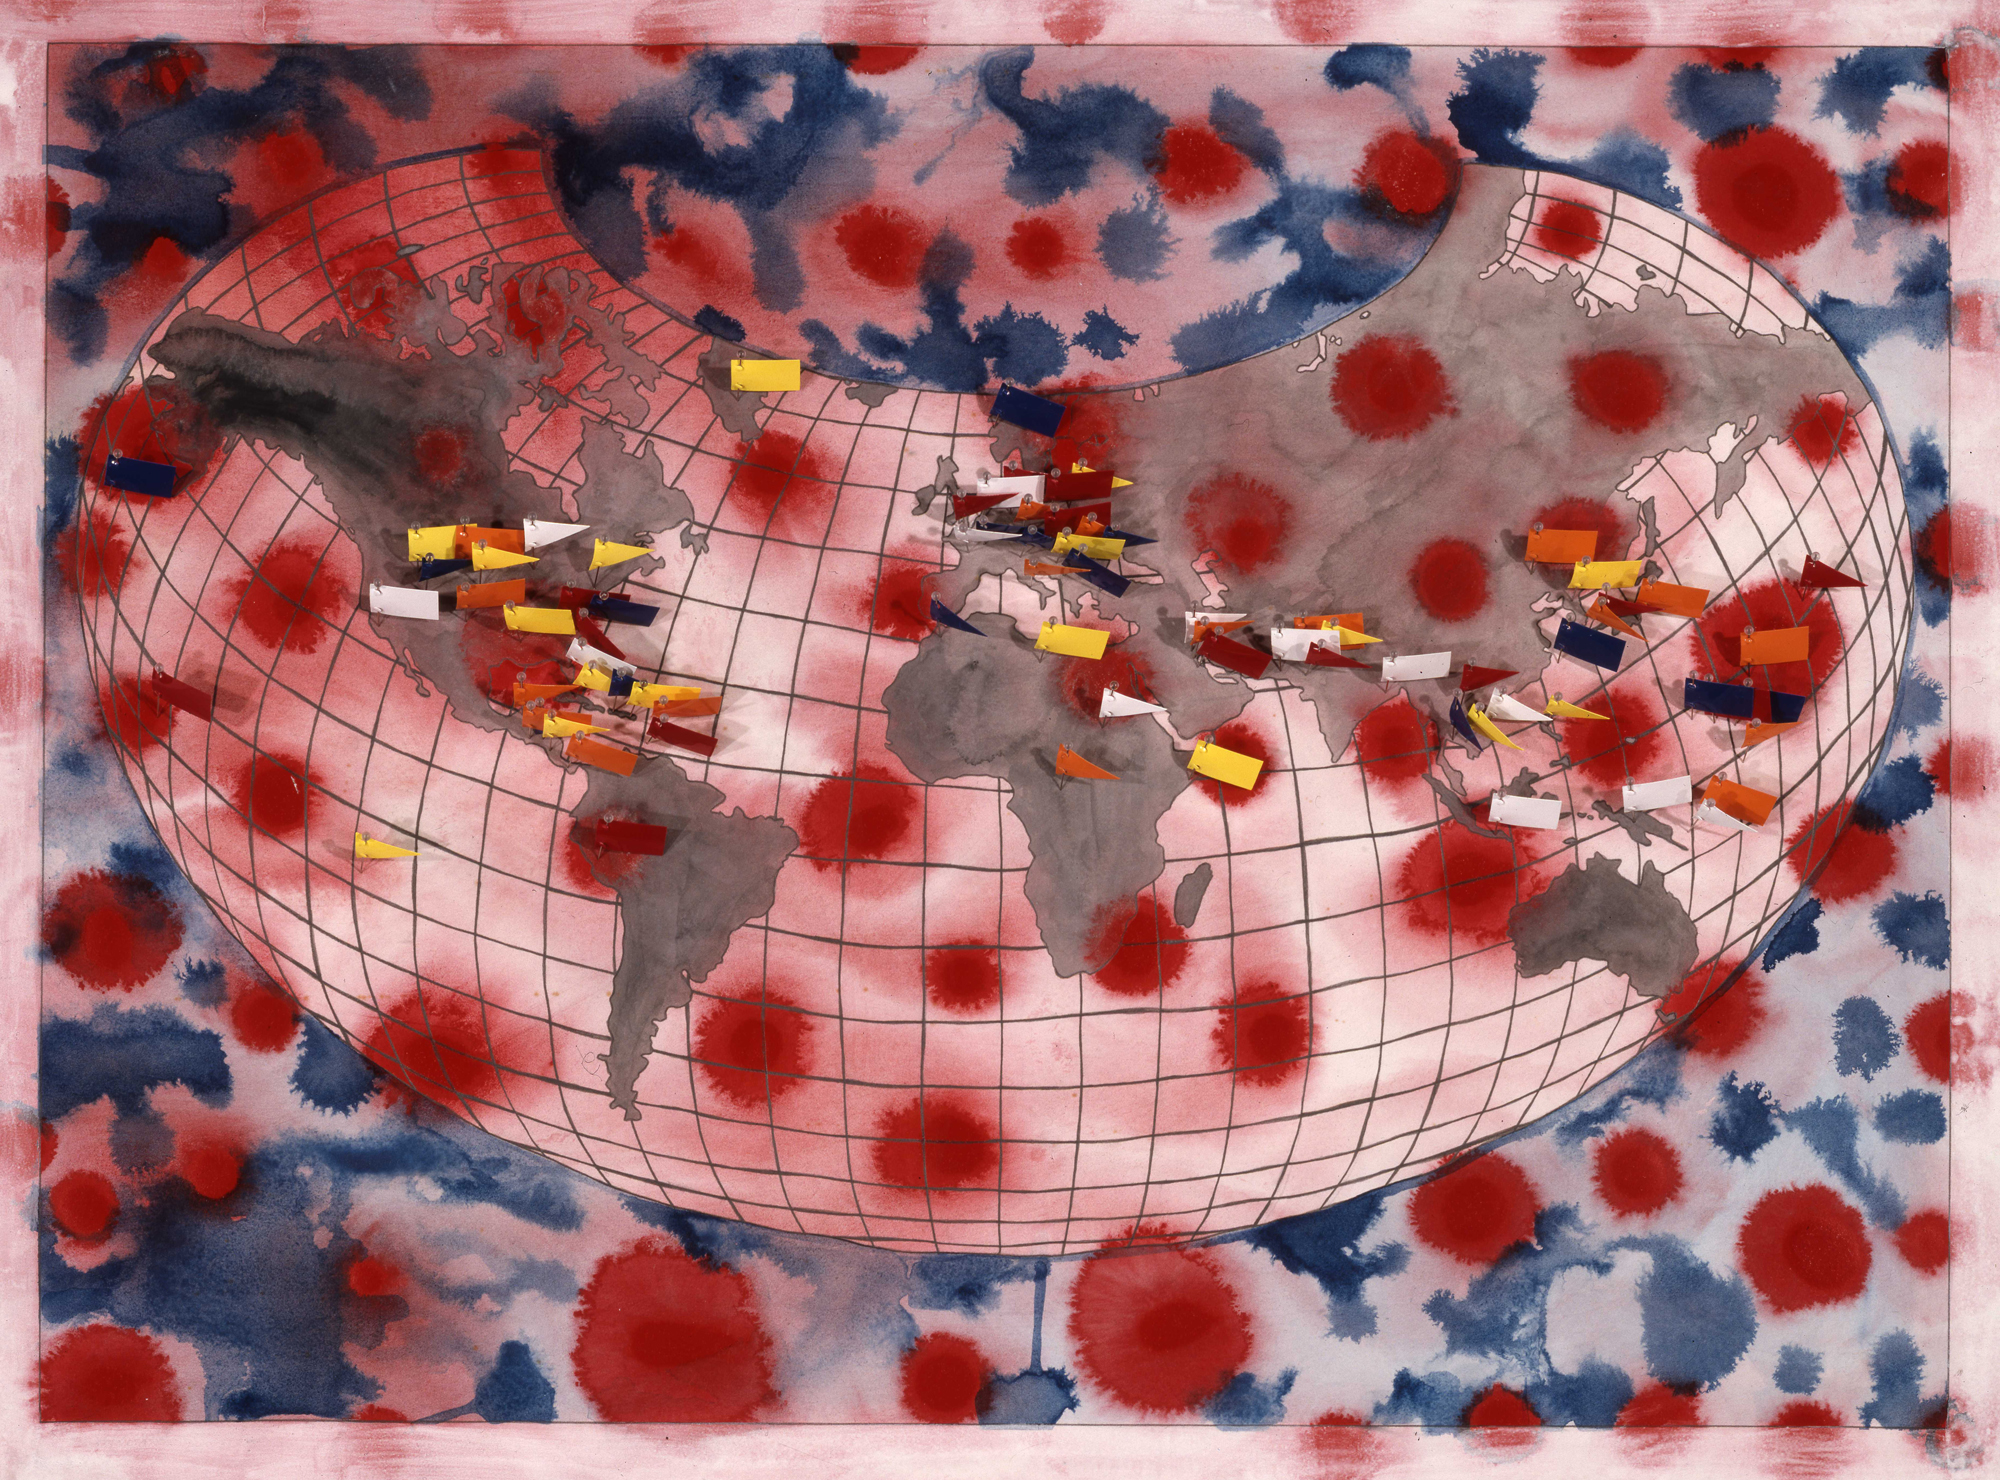
Whereas Hashimoto’s map presents a precise plotting of nuclear buildup across time, the artist elin o’Hara slavick combines mapmaking with drawing and watercolor to chart the locations and effects of US bombings. The mixed media works collected in her book Bomb After Bomb: A Violent Cartography use abstract colors and patterns to evoke violent acts and aftermath of bombing. The piece World Map, Protesting Cartography: Places the United States Has Bombed, 1854–Ongoing makes visible the shocking range of US bombing locations, marking each site with a bright, ironic flag and employing bright red splotches evocative of explosions or bloodstains. As slavick explains,
each [drawing] begins with ink or watercolor dropped onto wet paper like bloodstains on damp clothing. When it dries this becomes the foundation upon which to tell a violent story. I use this ground of abstract swirling or bleeding to depict the manner in which bombs do not stay within their intended borders. Depleted uranium and chemical agents contaminate the soil, traveling in water and currents of air for decades. Mines and unexploded bombs lay in wait for unsuspecting victims who were not even alive during the war (2007, 97).
Other drawings, depicting bombings in sites as widespread as a pharmaceutical plant in Sudan, the Middle East, Central America, Peru, Philadelphia, Alaska, and Utah, invoke the cellular scale at which bombs exert long term effects by heightening risks of cancer and congenital disorders: “The cellular references that appear in many of the drawings—replicated stains in the background, connected tissue in the foreground, concentric targets like microscopic views of damaged cells—conjure up the buried dead and deadly diseases as a result of warfare” (slavick 2007, 102). slavick’s reimagined aerial photographs and maps overlay eye-catching colors and beautiful abstract imagery with violent events in an effort to attract and implicate viewers entangled with US military power. If she describes her artworks as presenting “a violent cartography,” it is only because mapmaking has long been part of violent colonial and neocolonial projects: the abstract lines and grids on conventional maps hide the wars, bombings, dislocations, surveillance, and military practices that create and maintain geopolitical boundaries.

elin o’Hara slavick, World Map, Places the United States has Bombed, 1854–Ongoing from the series Bomb after Bomb: A Violent Cartography. Flag pins mark bomb sites for which there are corresponding drawings.
elin o’Hara slavick, from the series Bomb after Bomb: A Violent Cartography. Peru, 1960–1965. For Hugo Blanco.
elin o’Hara slavick, from the series Bomb after Bomb: A Violent Cartography. Peru, 1960–1965. For Hugo Blanco.
elin o’Hara slavick provides the following caption:
“CIA official Victor Marchetti said that Green Berets participated in what was the CIA’s single large-scale Latin American intervention of the post-Bay of Pigs era….The American objective in Peru—to crush a movement aimed at genuine land reform and social and political changes—was identical to its objectives in Vietnam. The methods employed were similar: burning down peasants’ huts and villages to punish support for the guerillas, defoliating the countryside to eliminate guerrilla sanctuaries, saturation bombing with napalm and high explosives, even throwing prisoners out of helicopters” (Blum 1995, 174).
Reproduced with permission.
This work is used by permission of the copyright holder.
Bibliography
Blum, William. Killing Hope: U.S. Military and CIA Interventions since World War II. Monroe: Common Courage Press, 1995.
Kuletz, Valerie. The Tainted Desert: Environmental Ruin in the American West. New York: Routledge, 1998.
———. “The Movement for Environmental Justice in the Pacific Islands.” In The Environmental Justice Reader: Politics, Poetics, & Pedagogy, edited by Joni Adamson, Mei Mei Evans, and Rachel Stein, 125–42. Tucson: University of Arizona Press, 2002.
Perez, Craig Santos. from unincorporated territory [hacha]. Kane’ohe, HI: Tinfish, 2008.
slavick, elin o’Hara. Bomb after Bomb: A Violent Cartography. Milan: Charta, 2007.
Williams, Terry Tempest. Refuge: An Unnatural History of Family and Place. New York: Vintage, 1992.
Wood, Dennis, and John Fels. The Power of Maps. New York: Guilford, 1992.
Representing Environmental Risk in the Landscapes of US Militarization
This virtual exhibition curated by literary scholar Hsuan Hsu examines the environmental impact of US military activities worldwide and how activists have used art and other forms of representational media to convey the harmful effects of militarization on the local population and landscape.
Hsuan HsuAbout the author


