Historical cartography
Maps are political rather than objective representations of a place. By selecting some pieces of information and codifying them, while silencing others, maps work as political discourses and are used as “marching orders” of geographies to be built.
The bird’s-eye-view maps of Bogotá included in this section are chapters of the narrative of the city as a modern artifact. Throughout the late nineteenth and the first decades of the twentieth century, urban plans effectively helped consolidate the idea of Bogotá as a human achievement where mountains, rivers, topography, and the entire ecology of the city were no longer visible, and therefore no longer mattered.
Since its foundation in the sixteenth century and through the end of the nineteenth century, the city had grown slowly without expanding beyond the natural barriers of the Eastern Mountains and the San Francisco and San Cristóbal rivers. Most maps at the time graphically acknowledged the dependence of the city on the Eastern Mountains, emphasizing the foothills through the use of colors, shades, and textures. The rivers, usually drawn as wide meandering lines, descend from deforested mountains and cross the urban grid to reach the western savanna, represented in some plans as an ample green plain with wetlands almost as big as the city.
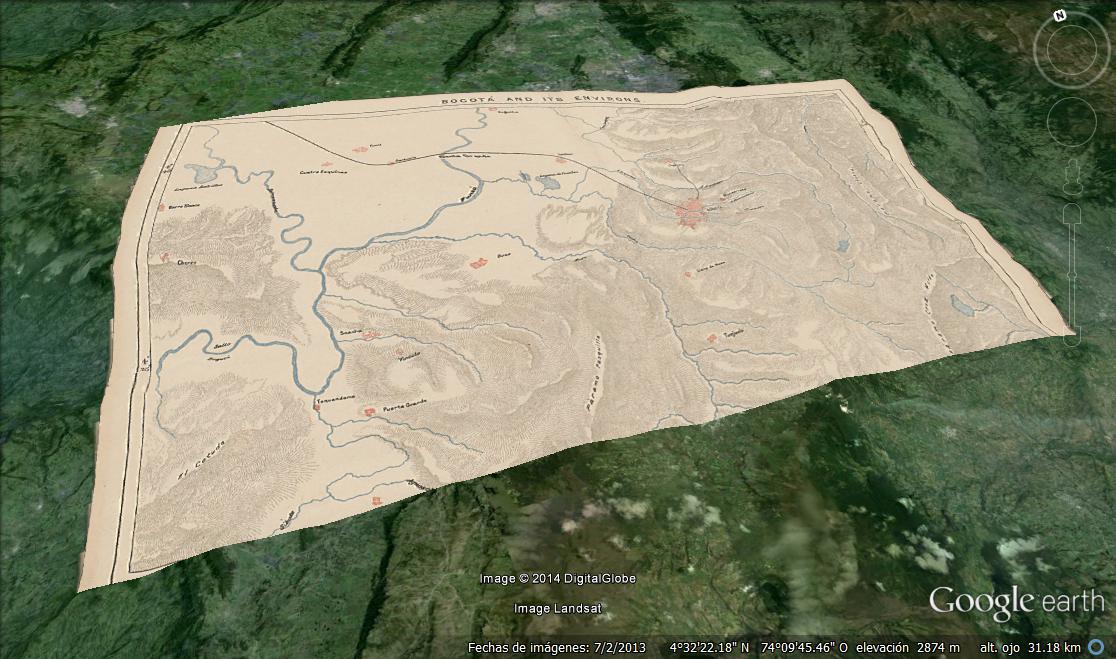
The 1894 map by the French geographer and anarchist Elisée Reclus takes a regional perspective of the city and gives a prominent role to the ecological structure of Bogotá. His map shows Bogotá’s rivers flowing from the páramos and running downward to join the Funza River, also known as the Bogotá River. Unlike most of his fellow cartographers, Reclus oriented his map with north at the top.
However, during this time another cartographic discourse was taking place among Colombian topographers. The 1894 map redrawn by Rafael Álvarez Salas based on a 1891 map by Carlos Clavijo is one of the most frequently reproduced plans and a distinctive “transition map” of historical Bogotá: the modern city is emerging, but nature is still at work. Water history is visible in the serpentine streets—eloquent traces of river lines—and so are water storage tanks and public baths. The still small and concentric city dissolves into the eastern foothills.
By 1910, the year of major public celebrations of the first centennial of independence from Spain, the cartographic transition was complete and engineer Alberto Borda Tanco commemorated the modern city in his map. The city is now depicted as distinctly separate from the Eastern Mountains, the savanna is muted, and Bogotá is a set of ordered”—that is, under control—blocks.
The 1935 map by the powerful engineer Julio César Vergara y Vergara is the historical vision of a generation of urban planners. After compiling a set of both rare and better-known historical maps, Vergara y Vergara’s map depicted the history of a dramatic expansion which would, in fact, eventually surpass anything he had imagined. As rivers were channelized, they were drawn as narrow lines. Meanwhile, the blocks, roads, parks, and other urban facilities acquired visual prominence.
To view these historical maps of the city of Bogotá and its surroundings, which have been overlaid on top of the georeferenced satellite images of the region, you need to have Google Earth installed and running on your computer.
The following video tutorial will help you navigate the interactive maps:
The original virtual exhibition features a video tutorial that will help users navigate the interactive maps. View the tutorial here (https://www.youtube.com/watch?v=7oWwOaE0i2o).
1. Map by Elisée Reclus (1894)

Map made by the French geographer Elisée Reclus in 1894. It shows the surroundings of Bogotá, making evident the nearby towns as well as the topography and hydrology of the area. North of Bogotá, one can see the suburb of Chapinero, and farther away the town of Usaquén, while the small village of Tunjuelo appears in the south. The wide western savanna is the home of many towns, such as Engativá, Fontibón, Funza, Bosa, and Soacha, most of which are part of the urban area of Bogotá today. The Fucha and Arzobispo rivers emerge from the Cruz Verde Páramo, while the San Francisco and San Agustín rivers spring from the Eastern Mountains, closer to the city. All of these rivers flow down the slopes, going through the city and its peripheries to finally arrive in the Funza River, also known as Bogotá River, which is drawn in the northwest corner of the map.
Map made by the French geographer Elisée Reclus in 1894. It shows the surroundings of Bogotá, making evident the nearby towns as well as the topography and hydrology of the area. North of Bogotá, one can see the suburb of Chapinero, and farther away the town of Usaquén, while the small village of Tunjuelo appears in the south. The wide western savanna is the home of many towns, such as Engativá, Fontibón, Funza, Bosa, and Soacha, most of which are part of the urban area of Bogotá today. The Fucha and Arzobispo rivers emerge from the Cruz Verde Páramo, while the San Francisco and San Agustín rivers spring from the Eastern Mountains, closer to the city. All of these rivers flow down the slopes, going through the city and its peripheries to finally arrive in the Funza River, also known as Bogotá River, which is drawn in the northwest corner of the map.
Historical map: Public domain. Courtesy of Biblioteca Nacional de Colombia.
Overlap of the historical map over satellite imagery from Google Earth: Creative Commons Attribution-NonCommercial-ShareAlike 3.0 Unported License. 2014. Biblioteca Nacional de Colombia.
Please click on the following link to download and open the Google Earth file:
1894_bogota_map_elisee_reclus.kmz
2. Map by Rafael Álvarez Salas (1894)
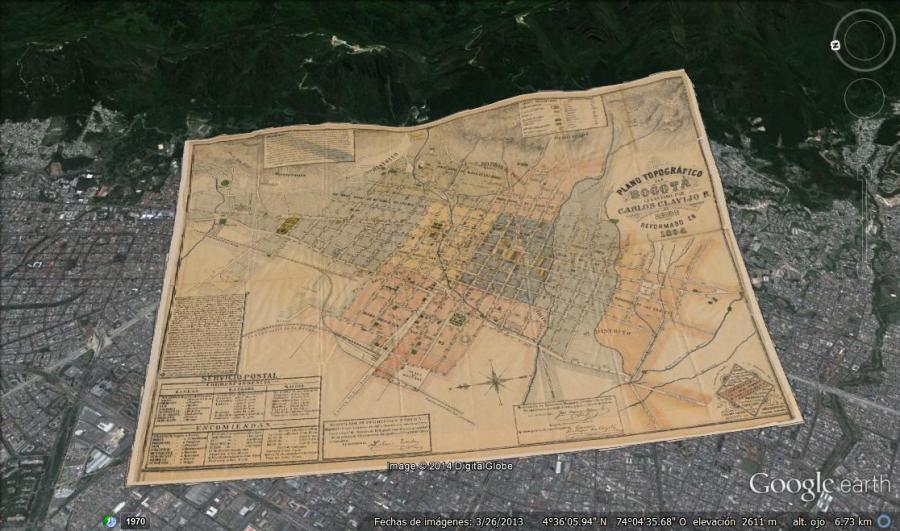
Map made by Carlos Clavijo in 1891 and revised by Rafael Álvarez Salas in 1894. By this time, the city of Bogotá was divided into five police quarters and eight ecclesiastical districts called parroquias, which are shaded in different colors on the map. The map identifies the main squares and parks of the city, the government buildings, the educational and cultural institutions, and the Catholic churches, as well as a number of banks, factories, brickworks, hotels, and restaurants. The rivers and streams that descend from the mountains of Monserrate and Guadalupe run through the city, shaping the streets and blocks. Near the San Bruno Rivulet, tributary of the San Francisco River, are the water storage tanks of the Egipto neighborhood, used since the late nineteenth century to store water for the municipal aqueduct service. Northeast of the city, in the foothills of Monserrate, are the Baños de la Tuerta Chepa, an example of what once were public bathhouses.
Map made by Carlos Clavijo in 1891 and revised by Rafael Álvarez Salas in 1894. By this time, the city of Bogotá was divided into five police quarters and eight ecclesiastical districts called parroquias, which are shaded in different colors on the map. The map identifies the main squares and parks of the city, the government buildings, the educational and cultural institutions, and the Catholic churches, as well as a number of banks, factories, brickworks, hotels, and restaurants. The rivers and streams that descend from the mountains of Monserrate and Guadalupe run through the city, shaping the streets and blocks. Near the San Bruno Rivulet, tributary of the San Francisco River, are the water storage tanks of the Egipto neighborhood, used since the late nineteenth century to store water for the municipal aqueduct service. Northeast of the city, in the foothills of Monserrate, are the Baños de la Tuerta Chepa, an example of what once were public bathhouses.
Historical map: Public domain. Courtesy of Biblioteca Nacional de Colombia.
Overlap of the historical map over satellite imagery from Google Earth: Creative Commons Attribution-NonCommercial-ShareAlike 3.0 Unported License. 2014. Biblioteca Nacional de Colombia.
 This work is licensed under a Creative Commons Public Domain Mark 1.0 License.
Please click on the following link to download and open the Google Earth file:
1894_bogota_map_rafael__alvarez_sala.kmz
3. Map by Alberto Borda Tanco (1910)
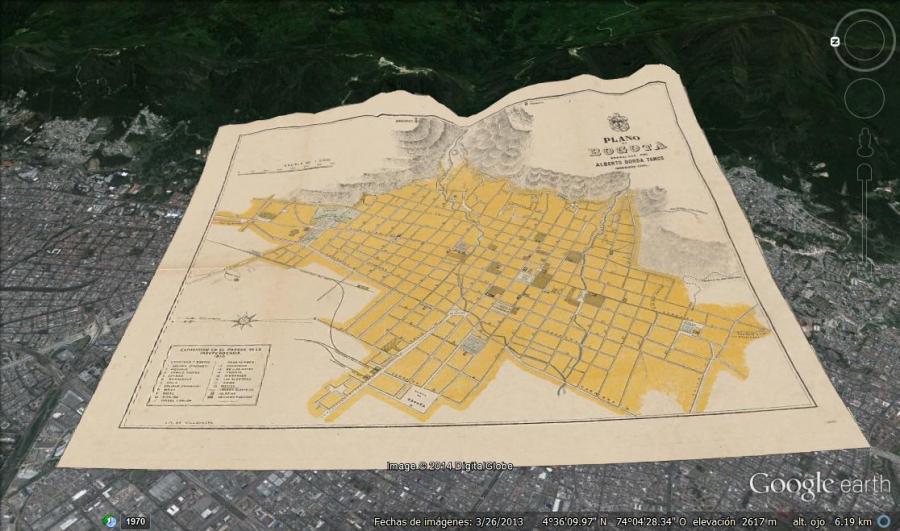
Map made in 1910 by the civil engineer Alberto Borda Tanco, elected President of the Board of Celebrations for the First Centenary of the Colombian Independence. The map was a cartographic support for the works and events that were part of the celebrations, thus showing the newly opened Parque de la Independencia with the different pavilions that were built for the national exhibition. But it also presents the image that engineers had about a city that had just begun its search for modernity. That is why the map shows not only the churches and government buildings, but also the organized blocks of the urbanized area, interspersed with squares and green parks and defined by paved streets over which there were electric or horse-drawn tram lines. Three railways and a cemetery located on the western outskirts also account for a glimpse of urban modernity. The urban water system is also marked: the map shows the San Agustín and San Francisco rivers, as well as the storage tanks located in the Egipto and San Diego neighborhoods, over the foothills of the Eastern Mountains. Paradoxically, the San Francisco River flowed down from the mountains through the Paseo Bolívar, a well-known poor settlement that lacked proper aesthetic and sanitary conditions, refusing any hint of modernity.
Map made in 1910 by the civil engineer Alberto Borda Tanco, elected President of the Board of Celebrations for the First Centenary of the Colombian Independence. The map was a cartographic support for the works and events that were part of the celebrations, thus showing the newly opened Parque de la Independencia with the different pavilions that were built for the national exhibition. But it also presents the image that engineers had about a city that had just begun its search for modernity. That is why the map shows not only the churches and government buildings, but also the organized blocks of the urbanized area, interspersed with squares and green parks and defined by paved streets over which there were electric or horse-drawn tram lines. Three railways and a cemetery located on the western outskirts also account for a glimpse of urban modernity. The urban water system is also marked: the map shows the San Agustín and San Francisco rivers, as well as the storage tanks located in the Egipto and San Diego neighborhoods, over the foothills of the Eastern Mountains. Paradoxically, the San Francisco River flowed down from the mountains through the Paseo Bolívar, a well-known poor settlement that lacked proper aesthetic and sanitary conditions, refusing any hint of modernity.
Historical map: All rights reserved. Courtesy of Biblioteca Nacional de Colombia.
Overlap of the historical map over satellite imagery from Google Earth: Creative Commons Attribution-NonCommercial-ShareAlike 3.0 Unported License. 2014. Biblioteca Nacional de Colombia.
The copyright holder reserves, or holds for their own use, all the rights provided by copyright law, such as distribution, performance, and creation of derivative works.
Please click on the following link to download and open the Google Earth file:
1910_bogota_map_alberto_borda_tanco.kmz
4. Map by Julio César Vergara y Vergara (1935)
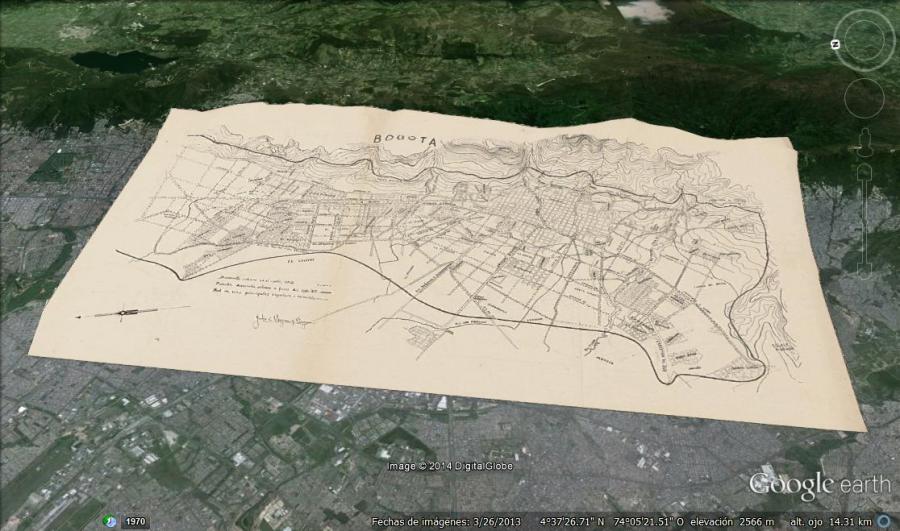
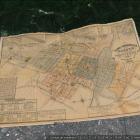
Made by Julio César Vergara y Vergara in 1935, this map was included in an academic article about the urban development of Bogotá four centuries after the Spaniard foundation in 1538. The map shows the existing neighborhoods by the 1930s, along with a proposal for widening of major roads. The author also includes an hypothetical urban perimeter by the end of the twentieth century, for a city with an population estimated at 900,000. However, Bogotá had more than six million inhabitants by the end of the century, thus surpassing this hypothetical perimeter. The map shows the course of the Arzobispo, Fucha, and San Francisco rivers. The last of these, near its origins close to the mountains, has already been channeled under an avenue named Avenida Jiménez.
Made by Julio César Vergara y Vergara in 1935, this map was included in an academic article about the urban development of Bogotá four centuries after the Spaniard foundation in 1538. The map shows the existing neighborhoods by the 1930s, along with a proposal for widening of major roads. The author also includes an hypothetical urban perimeter by the end of the twentieth century, for a city with an population estimated at 900,000. However, Bogotá had more than six million inhabitants by the end of the century, thus surpassing this hypothetical perimeter. The map shows the course of the Arzobispo, Fucha, and San Francisco rivers. The last of these, near its origins close to the mountains, has already been channeled under an avenue named Avenida Jiménez.
Historical map: All rights reserved. Courtesy of Biblioteca Nacional de Colombia.
Overlap of the historical map over satellite imagery from Google Earth: Creative Commons Attribution-NonCommercial-ShareAlike 3.0 Unported License. 2014. Biblioteca Nacional de Colombia.
The copyright holder reserves, or holds for their own use, all the rights provided by copyright law, such as distribution, performance, and creation of derivative works.
The City's Currents: A History of Water in 20th-Century Bogotá
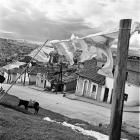
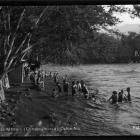
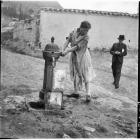
This exhibition explores the role of water in the struggle of Colombia’s capital to become a modern city. For Bogotá, complying with the standards of sanitary reformers and the governing elite was a social, technological, and environmental control endeavor. The exhibition examines everyday and gendered experiences of water, such as washing clothes or bathing, as well as urban infrastructural interventions including the domestication of rivers for water supply and wastewater disposal systems.
Stefania Gallini, Laura Felacio, Angélica Agredo, and Stephanie GarcésAbout the author


